Bank of England's analysis of QE is flawed – its policies are not working
Evidence for Treasury Select Committee consultation on the distributional effects of Quantitative Easing
by Dr. Ros Altmann
(All material on this page is subject to copyright and must not be reproduced without the author’s permission.)
Introduction:
The Bank of England’s distributional analysis of the impact of its monetary policies is flawed. The analysis has failed to explore the age and income distribution effects of monetary policies which have damaged savers, older generations and pensions. By asserting that without QE, UK growth and unemployment would have been much worse, all negative consequences are excused. The Bank has failed to consider the distributional impacts on their own merits or demerits and, thereby, underestimated the impact of monetary policy on national income and wealth. The Bank’s analysis also fails to adequately factor in the effect of above-target inflation on real incomes. Finally, it does not allow for the possibility that Quantitative Easing may not work as intended, because the combination of low interest rates and QE in a heavily over-indebted economy acts rather like a tax increase on older generations which comprise over half of all households in an aging population. It is most particularly middle class savers and pensioners who have been disadvantaged. The very wealthiest have benefited at the expense of those lower down the wealth and income scale and younger borrowers have benefited at the expense of older savers or pensioners.
Flaws in the Bank of England’s distributional analysis:
- It ignores the distributional impacts of inflation
- It assumes pre-2009 pensioners and anyone who bought annuities before QE started has not been affected, but this is not true as QE increased inflation
- It does not adequately quantify the redistribution of national income from older generations to younger borrowers and national wealth from middle to upper groups
- It underestimates the impact of QE on UK DB pension funds and their sponsors
- It underestimates the impact of QE on DC pensions and annuity income. The distributional effects will not balance out over the economic cycle for annuitants
- It does not consider the impact of QE on income drawdown
- It fails to factor in the ‘non-normal’ state of the UK economy (e.g. overindebtedness of borrowers, an impaired banking system and aging population whose pensions depend on gilt yields)
- It ignores the possibility that it has created a bubble in the ‘risk-free’ gilt market
- It admits its estimates involve significant uncertainty but gives no other scenarios
- It assumes no other policies would have been introduced apart from gilt-buying, thereby justifying any side-effects on the basis that all would be worse without QE
The Bank’s analysis of its policies can be criticised firstly because it does not properly quantify the actual distributional effects across age and income groups, and secondly because it does not consider the impact of these distributional effects on the effectiveness of the policy itself. This consultation response looks at both aspects.
The Bank has failed to recognise the impact of the distributional effects of its policies on economic wellbeing, as well as on consumption and growth. Its distributional analysis suggests QE has had a ‘broadly neutral’ impact on pensioners, pension funds and annuities, but this is not correct.
The Bank’s analysis fails to quantify the extent of the redistribution of national income and wealth among different age and income groups, despite acknowledging that savers lost £70billion between September 2008 and April 2012. It points to the £100billion that has been ‘gained’ by borrowers having to pay less on their loans (of which £90bn is lower mortgage payments) and concludes that the impacts on the economy have been positive. However, the beneficiaries of the £100billion boost are not the same as those who have suffered the £70billion losses. For example, most over 50s did not reap the benefits of lower mortgage payments enjoyed by younger households, but have suffered the costs of lower savings and annuity rates plus higher inflation resulting from Bank of England policies. The improvement in financial asset values has benefited the wealthiest 5% of households – it is not evenly spread across the population.
The Bank did not quantify distributional impacts on specific groups affected:
Groups damaged by monetary policies
- Older people – over 50s
Savers relying on interest income in the face of negative real interest rates
Pensioners buying annuities
Pensioners in income drawdown
Companies with defined benefit pension liabilities
Pension scheme members whose schemes failed due to QE impact on deficits
Groups who benefit from monetary policies
- Borrowers, especially those with tracker mortgages
- Wealthiest asset owners
- Banks
- Gilt traders or market makers
- UK Government
Distributional impacts of QE may undermine its effectiveness – it’s like a tax increase:
QE, coupled with ultra-low rates, has acted like a tax increase on older citizens, as it has reduced their current and prospective incomes. There is an issue of democratic accountability here as the Bank of England’s policies make one group of the population poorer, and transfer resources from them to others without any parliamentary debate. Worryingly, this could also affect long-term economic activity. QE has already made many pensioners permanently poorer, as they cannot undo the impact of low annuity rates in future. Also, pensioner inflation has been significantly higher than the national average.
Much of the Bank’s justification for QE rests on the assertion that without QE and 0.5% bank rate, the economy and employment would have been far worse. This claim is impossible to prove and the Bank has not evaluated alternative policy options other than gilt-buying.
It is not realistic to assume nothing else would have been done to boost growth. Buying gilts with newly created money is not – and never was – the only policy option available to stimulate growth. Indeed, these distributional impacts may be partly responsible for the lack of economic growth. The side-effects of forcing down both short- and long-term interest rates have weakened significant parts of the economy, especially with an aging population, over-extended borrowers and pension deficits.
Part of the weakness of the Bank’s distributional analysis is that it fundamentally relies on the assertion that QE itself will boost growth. Indeed, the very distributional impacts which the bank underestimates, could actually be undermining its effectiveness.
QE might help combat deleveraging by banks or over-indebted households, but this does not necessarily generate growth. Monetary Policy can buy time for Government to introduce new demand-stimulus measures, supply-side reforms and reducing fiscal imbalances. But, without other measures, buying gilts is unlikely to generate growth as the Bank describes.
Indeed, the Bank has not provided convincing evidence that QE has worked – its research merely asserts that this must be the case. Printing new money and debasing a currency are not historically successful methods of boosting an economy – quite the reverse. They are often expedient short-term political palliatives, which fail to solve the underlying problems and generally have damaging long-term consequences.
The significant omissions from the Bank’s distributional impacts of its monetary measures are detailed in Section One of this submission. The evidence that calls into question the actual effectiveness of the Bank’s policies is discussed in Section Two.
SECTION ONE: FLAWS IN DISTRIBUTIONAL ANALYSIS
1. Impact of inflation
The Bank has ignored the distributional impact of above-target inflation:
The original aim of QE was to fight Japanese-style deflation which, in 2009, seemed a real risk. However, there was no deflation in the UK and inflation has remained above target. The Bank confirms that QE increased the UK’s inflation rate, yet the impact of overshooting inflation has not been adequately factored into the Bank’s analysis of the distributional consequences of monetary policy.
A recent ONS paper confirms that inflation is an important indicator of economic wellbeing – (here is a link www.ons.gov.uk/ons/dcp171766_284260.pdf ) and that inflation can have serious negative distributional impacts on economic wellbeing and consumer spending. The ONS says “the rate of inflation relative to the rate of interest has an important impact on the distributional effects of the economic wellbeing.” The combination of low interest rates and high inflation had significantly reduced disposable incomes. Inflation erodes savers’ capital and income, leaving them less money to spend and weakening economic activity in the short and medium term. The Bank’s analysis has not factored in the probability that pensioners whose pensions and savings income falling, will cut their spending.
Chart 1 shows how interest rates on deposits and savings accounts fell sharply and remained low, even while inflation stayed above target. Negative real interest rates after 2009 left older generations facing cuts in their nominal and real incomes.
Chart 1: Inflation and interest rates paid on savings (Source ONS Wellbeing report Figure 9)
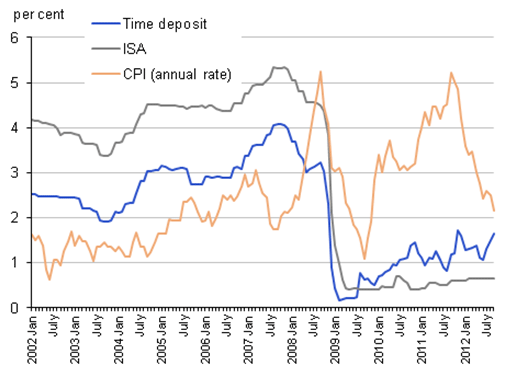
Chart 2: Pensioner inflation – ONS Pensioner Inflation Index, Saga price Indices and national Retail Price Index, cumulative % change:
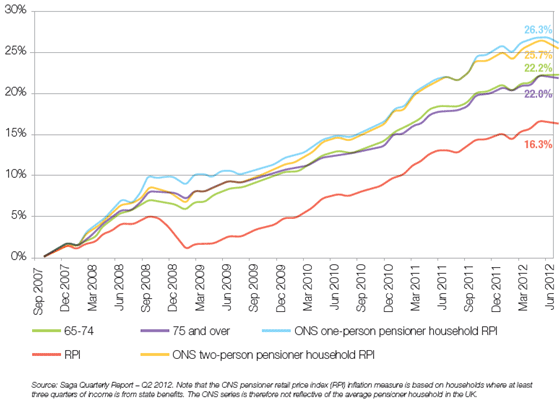
In fact, the distributional consequences of higher inflation have been magnified as older generations suffered even higher inflation than the all-age national average.
Chart 2 shows the cumulative effect of inflation, since Northern Rock failed. Age specific rpi for older age groups was well over 20% compared with the whole population rpi of 16.3%. And the ONS measure of pensioner inflation reports a cumulative price rise of 26% for pensioners. Therefore, older people have faced far higher inflation than younger age groups, because inflation was driven by the cost of essentials. Older and poorer households spend a higher proportion of their income on these items, so QE has damaged them more.
2. Pre-2009 pensioners have been damaged by QE:
The Bank’s report states “As far as the impact of QE on pensioners goes, the incomes of those already drawing a pension before QE began will have been unaffected”. This is not correct. Anyone living on a fixed annuity will have suffered reduced income as inflation whittled away their purchasing power. Around 95% of annuities have no inflation protection so these pensioners become poorer over time. In addition, pensioners in capped income drawdown have been damaged by QE as their incomes are tied to falling gilt yields. Many drawdown pensioners are facing income cuts of well over 30%, so QE has indeed damaged pre-2009 pensioners.
The distributional impact of QE on pre-2009 pensioner also has implications for the effectiveness of monetary policies. By failing to appreciate the damage done by inflation to older people’s incomes, the Bank has underestimated the negative side effects of QE and these may have undermined its power to boost growth. Since 2010, Saga’s regular quarterly surveys have asked about the concerns of the over 50s and inflation has been by far their largest worry. Then, when asked what they are doing in response to the rising cost of living, they have consistently reported that they are cutting spending, including less meals out in restaurants, visits to the pub, clothes shopping and entertainment. Many report cutting back on essentials too. This is not what the Bank would have expected, however the latest GDP figures confirm that private consumption has been weak, so it is important to quantify the impact on pre-2009 pensioners as well as other older age groups when assessing monetary policy.
Monetary policy has redistributed national income and wealth – and acted like a tightening of fiscal policy:
QE and low rates reduce the incomes of savers and pensioners. This is like a tax increase. The Bank does not offer an adequate age or income distribution analysis of how the benefits and costs of QE are distributed. Income has been redistributed from older savers or pensioners to younger borrowers and banks. The ONS Wellbeing report states “a relatively high inflation rate redistributes net wealth from savers to debtors” and “can redistribute wealth from the older to the younger generation.” QE takes money away from savers and pensioners by reducing both nominal and real incomes.
Meanwhile, wealth has been redistributed from middle classes towards the wealthiest groups. The Bank of England claims it has boosted the value of stocks and bonds by £600bn and that this is ‘equivalent to £10,000 per person if asset were evenly distributed across the population’. But assets are not evenly distributed so gains will have gone largely to the wealthiest households. The bulk of financial assets are held by the top 5% of households. Median households had £1500 gross assets, while the top 5% had an average of £175,000. As the Bank itself says, “those households with significant asset holdings will benefit by more than those without”. Chart 3 below shows the redistribution of wealth resulting from QE, using the Bank’s estimates.
Chart 3: Distribution of wealth effects of QE
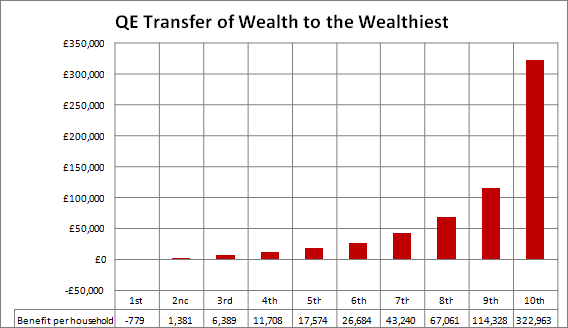
Source: Bank of England
This redistribution has taken place without any democratic debate about the fairness of this policy. The Bank report admits: “Some groups have borne a greater burden than usual from the sustained period of low interest rates. But on the other hand, the benefits have also been greater than usual, by helping to avoid a far worse outcome for the economy as a whole”. This assertion does not address the distributional inequity. Monetary policy has benefited some and penalised others, but alternative policies might have had far fewer such side-effects. The Bank does not evaluate or even address whether the distributional consequences of its policies are acceptable, because it assumes that buying gilts was the only possible policy option.
The Bank of England claims QE has boosted the value of financial asset holdings and that this “protects the value of savings and wealth”. However, asset prices are irrelevant to cash savers. Only 14% of financial assets are in shares, the rest are in bank/building society accounts, ISAs and National Savings which have not necessarily benefited from QE. What is far more important to savers – and is hardly mentioned by the Bank – is the fact that QE has also increased inflation. The ONS points out that “a high rate of inflation reduces the real value of wealth held in cash terms”, so monetary policy has redistributed wealth away from middle class savers with large cash holdings by devaluing their savings, in favour of wealthier asset-owners who hold non-cash savings.
High house prices help borrowers and banks, rather than older people:
The Bank also suggests that its policies have supported house prices and that this benefits the economy. “To the extent that QE prevented a deeper recession and a sharper fall in employment, the fall in house prices during the crisis is likely to have been smaller than would otherwise have been the case”. It is normally assumed that high house prices have benefited older generations. Much of the UK’s housing wealth belongs to the over 50s who have largely or completely paid off their mortgages. The wealth effect of high house prices, however, is far weaker than the income effects of falling real incomes.
The benefits of high house prices are not evenly distributed. In fact, younger age groups, with the largest mortgage debts, have benefited most from QE as well as lenders who might otherwise face higher default rates. This artificially supports house prices. On most measures, however, housing is far too expensive, which prevents younger generations getting on the housing ladder. The Bank has not considered this aspect of the distributional impacts of QE. Perhaps we should be less concerned about supporting house prices and address the shortage of housing, rather than keeping housing unaffordably expensive. Table 1 and Chart 4 show how QE has improved the incomes of younger borrowers who do own houses, by cutting mortgage costs, but has hardly helped the over 50s:
Table 1: Generational effects of mortgage rate cuts following QE:
Average mortgage spending per week fell sharply for younger borrowers but not over 50s:
| 2007 | 2010 | Change in mortgage spending | |
| Age under 30 | £57.10 | £35.50 | £21.60 lower |
| Age 30 – 49 | £92.20 | £71.70 | £12.50 lower |
| Age 50 – 64 | £43.70 | £42.20 | £1.50 lower |
| Age 65 – 74 | £3.10 | £6 | £2.90 higher |
| Age 75 + | £1.60 | £1.60 | No change |
Source: ONS and Cebr
Chart 4: Average annual mortgage expenditure:
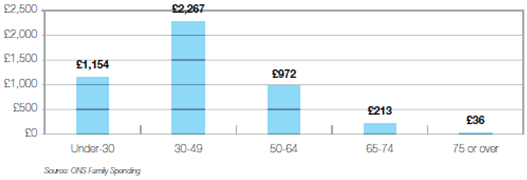
Source: ONS family spending survey
Saga surveys show that the over 50s would not mind too much if house prices fell by 20%. They can still maintain their lifestyle if the value of their house falls, as long as their income remains unaffected. However, QE has reduced their real income and constrained their spending power, without the offsetting benefits of lower rates. Older generations only benefit directly from rising house prices if they sell or release equity. In distributional terms, the mortgage spending figures show that the under 50s have gained substantially from monetary policy.
4. Defined Benefit pension schemes
QE has damaged UK defined benefit pension funds and their sponsors:
As the UK pension system is underpinned by gilt yields, artificially depressing long-term interest rates also depresses pension values, which imposes extra costs on companies sponsoring pension schemes, thereby reducing their earnings. The Bank’s distributional analysis report misrepresents QE’s impact on pension funds. It states: “The Bank’s assessment is that asset purchases have pushed up the price of equities by at least as much as they have pushed up the price of gilts”. QE has, of course, pushed up gilt prices, but equity markets and corporate performance also depend on other factors. In fact, pension assets have not kept pace with gilts and the Bank’s assertions that equity price rises have offset liability increases also ignore market volatility.
An example of the volatility of markets for defined benefit pension schemes is shown in the Pension Protection Fund regular reports on the health of UK pension schemes.
- In July 2011, the PPF deficits for UK pension schemes totalled £8.3bn.
- Just six weeks later, the PPF deficits had increased to £117.5bn.
- Then in July 2012 deficits had ballooned to £300billion.
This volatility of asset prices and pension deficits make falling gilt yields resulting from QE particularly problematic for companies already struggling to support their pension promises.
Indeed, traditional estimates suggest that a 1 percentage point fall in gilt yields leads to approximately a 20% rise in pension liabilities, but only a 6-10% rise in typical pension fund asset values. The Bank does admit that if pension funds were in deficit (as they almost all were in 2009) then QE will have worsened those deficits. However, it does not even attempt to quantify the actual effects on schemes. It also ignores the impacts on corporate UK. In fact, the damaging impact of QE on scheme deficits is another factor that may be undermining the effectiveness of QE itself.
Firms have had to put more money into their pension schemes, as their pension deficits have increased. This leaves less money to spend on expanding their businesses or creating jobs and mergers and acquisitions or corporate restructuring are hampered. Companies with pension schemes are also finding it increasingly difficult to access new bank loans. Some firms have even failed as a result of their pension problems.
QE is locking many defined benefit pension schemes in a vicious spiral:
Pension funds are becoming locked in a vicious circle in that they need money to support their business so they can earn more money to fund their pension scheme, but they cannot obtain more money because of the scheme itself. In addition, pension trustees with rising deficits often want to ‘de-risk’ by buying fixed income assets that more closely match their liabilities, or try to buy out their liabilities to reduce risk. But the more the Bank of England buys gilts, the more expensive – and unaffordable – it becomes for trustees to buy assets to reduce risk. If they compete with the Bank of England to buy more gilts, they drive gilt prices up more, which increases their deficits even further. For many schemes, this can be a ‘death spiral’. The Bank assumes pension funds are or should be invested in assets that ‘match’ their liabilities so that falling gilt yields will not impact them. This misunderstands pension reality. Firstly, there are no matching assets. Index-linked gilts only partially match inflation risks. Secondly, there are not enough index-linked gilts available so pension funds could not match their liabilities as they would need more than the total gilts in issue. Thirdly, UK pension funds hold a diversified range of assets, so their assets have not kept pace with gilts.
The Bank’s complacency on this issue is troubling. Pension funds are meant to be long-term, but QE has distorted them over the short-term. A recent note from Morgan Stanley estimated that firms with the biggest pension deficits compared to their market capitalisation have underperformed the stock market by 28% in the past three years.
5. Defined Contribution pensions and Annuities
QE has damaged defined contribution pensions and annuity income:
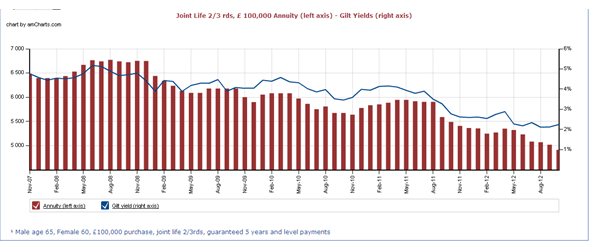
Chart 5 shows how annuity rates have moved in the past five years. It is clear that annuity income has fallen significantly as QE brought gilt yields down sharply.
Chart 5:
Source: Better Retirement Group
The Bank’s claims that pension assets will have risen to offset falling annuity rates do not stand up to scrutiny. It says: “QE has raised the value of pension fund assets too. Once allowance is made for that QE is estimated to have had a broadly neutral impact on the value of the annuity income.” This conclusion ignores market volatility and the importance of timing. In reality, the volatility of equity markets means many people have suffered significantly lower pensions as a result of QE. Whether particular pension investors do actually benefit from higher asset prices depends on what funds they are invested in and whether they happen to reach retirement in months when stock markets are at high or low levels. Most ordinary investors’ pension funds are not in gilts, but tend to be in with-profits or insurance funds and other assets which have not performed well enough to offset annuity falls resulting from QE. Retirees needing to buy their annuity at a low point in the equity market, or whose investment funds perform poorly, will have been damaged by QE and will never be able to recover their losses as their annuity is fixed for life – and normally without any inflation protection at all.
Table 2 highlights that equity markets have been very volatile, while annuity rates have fallen steadily and sharply over time.
Table 2: Movement of shares, gilts and annuities, 2007 – 2012
| FTSE 100 | 15 yr gilt yields % | Annuity rates age 65 male % | Income from £100,000 pension fund | |
| July 07 | 6607 | 5.31 | 7.39 | £7390 |
| Oct 07 | 6466 | 4.94 | 7.33 | £7330 |
| Jan 08 | 6456 | 4.44 | 7.32 | £7320 |
| April 08 | 5702 | 4.57 | 7.40 | £7400 |
| July 08 | 5625 | 5.13 | 7.32 | £7320 |
| Oct 08 | 4902 | 4.72 | 7.27 | £7270 |
| Jan 09 | 4434 | 3.89 | 7.22 | £7220 |
| April 09 | 3926 | 3.89 | 6.73 | £6730 |
| July 09 | 4340 | 4.29 | 6.80 | £6800 |
| Oct 09 | 5140 | 4.08 | 6.80 | £6800 |
| Jan 10 | 5142 | 4.44 | 6.76 | £6760 |
| April 10 | 5714 | 4.36 | 6.68 | £6680 |
| July 10 | 4838 | 3.86 | 6.37 | £6370 |
| Oct 10 | 5548 | 3.46 | 6.27 | £6270 |
| Jan 11 | 5971 | 3.95 | 6.40 | £6400 |
| April 11 | 5908 | 4.10 | 6.51 | £6510 |
| July 11 | 5945 | 3.90 | 6.50 | £6500 |
| Oct 11 | 5218 | 2.77 | 6.16 | £6160 |
| Jan 12 | 7624 | 2.61 | 5.80 | £5800 |
| April 12 | 5768 | 2.88 | 5.85 | £5850 |
| July 12 | 5493 | 2.34 | 5.62 | £5620 |
| Aug 12 | 5635 | 2.11 | 5.58 | £5580 |
Distributional effects will not balance out over the cycle:
The Bank says “Distributional effects typically balance out over the course of a policy cycle”. This is not true for those who have bought annuities (nearly half a million people a year) because they can never change their annuity even if rates go up again. With a fixed annuity, and no inflation protection, they will just become increasingly poorer over time.
Table 3 shows that a Defined Contribution personal pension, 100% invested in the stock market, would have delivered considerably lower pension income since 2008. Most pension investors have simply not seen their asset values rise to offset the fall in annuity income.
TABLE 3: Movements in equity and annuity rates
| FTSE | Annuity rate 65 year old male % | Change in FTSE vs. July 2008 | Change in Annuity rate vs. July 2008 | Fall in income if 100% in UK equities | |
| July 08 | 5625 | 7.32 | |||
| Oct 08 | 4902 | 7.27 | – 12.9% | – 0.7% | – 13.6% |
| Jan 09 | 4434 | 7.22 | – 21.2% | – 1.4% | – 22.6% |
| April 09 | 3926 | 6.73 | – 30.2% | – 8.1% | – 38.9% |
| July 09 | 4340 | 6.80 | – 22.8% | – 7.1% | – 29.9% |
| Oct 09 | 5140 | 6.80 | – 8.6% | – 7.1% | – 15.7% |
| Jan 10 | 5142 | 6.76 | – 8.6% | – 7.7% | – 16.3% |
| April 10 | 5714 | 6.68 | + 1.6% | – 8.7% | – 7.1% |
| July 10 | 4838 | 6.37 | – 14.0% | – 13.0% | – 27.0% |
| Oct 10 | 5548 | 6.27 | – 1.4% | – 14.3% | – 15.7% |
| Jan 11 | 5971 | 6.40 | + 6.2% | – 12.6% | – 6.4% |
| April 11 | 5908 | 6.51 | + 5.0% | – 11.1% | – 6.1% |
| July 11 | 5945 | 6.50 | + 5.7% | – 11.2% | – 5.9% |
| Oct 11 | 5218 | 6.16 | – 7.2% | – 15.9% | – 23.1% |
| Jan 12 | 5624 | 5.80 | 0 | – 20.8% | – 20.8% |
| April 12 | 5768 | 5.85 | + 2.5% | – 20.1% | – 17.6% |
| July 12 | 5493 | 5.62 | – 2.3% | – 23.2% | – 25.5% |
| Aug 12 | 5635 | 5.58 | 0 | -23.8% | – 23.8% |
6. Income Drawdown
The Bank’s analysis ignores the impact of QE on income drawdown:
Over 300,000 people who did not want to buy annuities have bought income drawdown policies, which allow them to draw an income from their pension savings, without having to annuitise. Unfortunately, however, the income that they are allowed to withdraw is set by the Government Actuary, to reflect the income that would be paid by a standard annuity. Since QE has reduced annuity income, it has also reduced drawdown income.
In fact, the reduction in drawdown rates has been particularly severe due to additional changes made by the Treasury in April 2011, when it was decided that the maximum withdrawal would be reduced from 120% of the GAD rate, to just 100%. Coupled with disappointing investment performance, the combined effects of QE and Treasury rule changes have resulted in people facing pension cuts of well over 30%. This would not have happened without QE’s impacts on gilt yields, and is causing real hardship to many pensioners across the country. Yet the Bank of England did not even mention this in its report.
Tables 4 and 5 show the impact of these combined changes on a £100,000 pension fund in the past three years.
For example, the maximum annual income a 65-year-old man could draw from a £100,000 capped drawdown pension fund declined from £7,920 in August 2009, to £5,300 in August 2012 and for a 65-year old woman fell from £7,440 to £4,900 last month. The last line of the table shows that a 65-year old man would need almost £150,000 in his drawdown fund in August 2012 to be able to withdraw the same income as a £100,000 would produce in August 2009.
TABLE 4: Drawdown income
| Male – by age | Female – by age | |||||
| 65 | 70 | 75 | 65 | 70 | 75 | |
| August 2009 | £7,920 | £9,000 | £10,800 | £7,440 | £8,520 | £9,960 |
| August 2012 (GAD rate reduced to 2.0%) | £5,300 | £6,200 | £7,700 | £4,900 | £5,800 | £7,000 |
| % change in maximum drawdown | -33.1% | -31.1% | -28.7% | -34.1% | -31.9% | -29.7% |
| Increase in value of pension fund required to maintain August 2009 income |
£49,434 | £45,161 | £40,260 | £51,837 | £46,897 | £42,286 |
Source: Cebr and Saga research
Table 5: Changes in GAD rate, 15 year gilt yields and standard annuity rates for 65-year old man.
| GAD rate | 15yr gilt | Annuity | |
| July 2008 | 5.00% | 5.13% | 7.32% |
| July 2009 | 4.00% | 4.29% | 6.80% |
| July 2010 | 4.00% | 3.86% | 6.37% |
| July 2011 | 3.75% | 3.90% | 6.50% |
| July 2012 | 2.25% | 2.34% | 5.62% |
Source: Better Retirement Group
SECTION TWO – DOES QE ACTUALLY WORK?
7. Bank’s flawed distributional analysis may have led it to overestimate effectiveness of QE – some evidence:
After previous recessions, the economy and household incomes recovered well from one and half years on (six quarters after the downturn). That would mean from third quarter 2009 the UK should have begun a good recovery. In fact, however, this time round, growth remained depressed and household incomes fell again from 2010 onwards. Despite the Bank of England’s measures, the economy continued to weaken as shown in Chart 6.
Chart 6: Net national income per head during three recessions (ONS Figure 3)
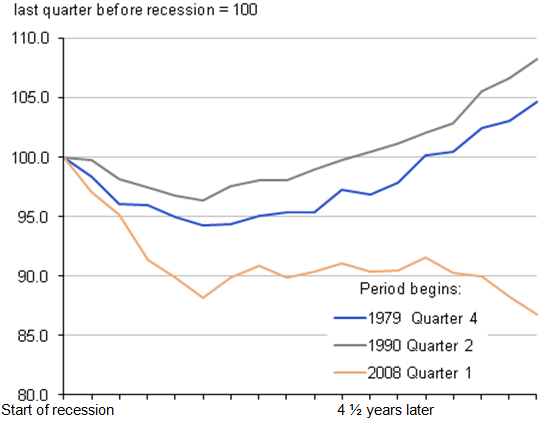
In the early stages of the recession interest rates reached historic lows and mortgage interest payments fell, meaning many householders’ disposable incomes rose as a result of lower mortgage payments. This helped through to mid 2009, however this effect wore off after 2009 and QE seems to have failed to provide new stimulus.
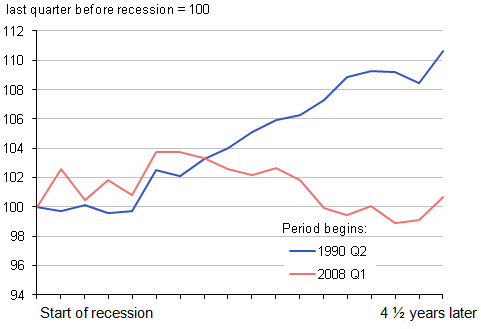
As the ONS itself says, “This fall in household actual income per head was primarily due to prices going up at an increasing rate over most of the period.” In other words, QE’s boost to inflation seems to have damaged household incomes in a way that had not happened after previous recessions. Chart 7 shows that real household actual income per head fell sharply after QE started, unlike previous recessions when it had started to recover at that point.
Chart 7: Real household actual income per head in two recessions (ONS Figure 4)
The UK economy is in a ‘non-normal’ state which has hampered QE effectiveness:
The Bank of England’s analysis has not properly factored in the UK’s unusual economic circumstances following the credit crisis.
The banking system is impaired:
Creating significant amounts of extra bank reserves does not necessarily lead to new lending when the banking system is impaired. Increasing the money supply through QE gilt-buying has hardly boosted business lending and many small or medium sized firms are still being starved of credit. Banks are using extra deposits to boost their balance sheets rather than lend.
QE obviously helps banks raise net interest margins and recapitalise their balance sheets, but this does not in itself help growth and employment. The weakened banks have become ultra-cautious in their lending, have increased charges and tightened terms. Table 6 demonstrates that, despite the expectation that QE would mean cheaper borrowing, banks have taken the opportunity to increase their margins. Lenders are also imposing high fees and charges and tough conditions on borrowers, especially small firms, who are finding it too expensive to borrow.
Table 6: Changes in borrowing rates since QE started:
| Date | Overdrafts | New personal loans | Credit cards (interest bearing only) |
| Mar 2009 | 8.44 | 7.87 | 17.82 |
| Apr 2009 | 8.48 | 7.07 | 17.93 |
| Oct 2009 | 8.45 | 6.63 | 18.00 |
| Oct 2010 | 8.21 | 6.71 | 18.52 |
| Oct 2011 | 10.78 | 6.84 | 18.11 |
| Jun 2012 | 9.93 | 7.08 | 18.21 |
| CHANGE | + 1.49 | – 0.79 | + 0.39 |
Borrowers too heavily indebted:
When borrowers are severely over-indebted and borrowing costs fall, they pay down their debts more quickly to bring themselves back to a more sustainable financial position, rather than increasing spending. Figures from the British Bankers Association, published on 23 October 2012, confirm that households do not have an appetite for increased loans, but prefer to reduce their debt levels. QE has certainly helped over-mortgaged homeowners with debt servicing costs but, again, this does not create growth. If borrowers are unwilling to increase their spending when they benefit from lower rates, QE will not work as intended.
An aging population disrupts income, substitution and wealth effects:
The Bank says it expects the ‘income effect’ of QE and low interest rates, which reduces income for savers but improves terms for borrowers, will lead borrowers to spend more. This is supposed to combine with a ‘substitution effect’ whereby households bring forward spending at the expense of saving as rates fall, thereby boosting growth. However, in an aging population, these expected effects may not materialise. Those who are retired or living on savings may cut spending and increase precautionary saving, due to fears for their financial future as rates stay low. Older generations are relatively debt-free, so their savings income has fallen, but they do not benefit from any offsetting positive income effects of low rates. The Bank also expects a ‘wealth effect’, as QE boosts asset prices, increasing household wealth. This is supposed to encourage more spending. However, older savers are more concerned about income prospects than asset prices. Middle class savers tend to hold 90% of savings in deposits of less than 2 years’ maturity, so they cannot benefit from increases in asset prices, while middle income groups will face falling income prospects when rates decline. Therefore, in an aging population, income, substitution and wealth effects may all fail to work as theory predicts.
UK pensions depend on gilt yields:
The Bank has underestimated the dangers of low gilt yields for company-sponsored pension schemes and for people buying annuities and income drawdown in retirement.
8. The Bank does not present alternative scenarios:
The Bank’s report says: ‘The effects of QE appear economically significant, though subject to considerable uncertainty” so its estimates that the first £200bn raised real GDP by 1 ½ – 2% and inflation by ¾ – 1 ½ %, are based on assumptions that may not be correct, but the Bank relies on them. The Bank also assumes that the next £175bn of gilts it has bought will have a similar impact on growth and inflation, but it is probable that subsequent rounds of QE have had diminishing effects. The Bank’s distributional analysis largely rests on its assumptions of QE having wide economic benefits, but it does not provide convincing evidence.
9. Should central banks artificially distort asset markets?
One also has to ask why a central bank should artificially boost shares or other asset prices, rather than leaving this to the markets. Gilts are supposed to be ‘risk-free’ assets, on which all other asset prices are based, but by artificially boosting gilt demand, it has distorted gilt prices. With inflation well above 2% and a huge budget deficit, gilt yields do not reflect the UK’s economic fundamentals. The Office for Budget Responsibility assumes the correct level for gilt yields is 4.5-5%, rather than 2% or below as now. In other words, QE has added risk to gilts, potentially creating an asset bubble in the very market that is supposed to be risk-free and on which other asset valuations are based. This adds risk to all assets.
10. The Bank assumes economy would have collapsed without buying gilts and ignores alternative policies:
There are many other policies that could have been implemented, other than just relying on QE:
Alternative policy proposals:
QE creates new money, but does not ensure it goes directly to where it is needed in order to create growth and jobs. There may be better policies to pursue, for example:
- Temporary tax breaks for capital projects: Introduce temporary tax breaks for capital spending to encourage companies to bring forward investment plans. The biggest benefit of QE is that it has allowed companies to borrow more cheaply and large firms are flush with cash. They are not spending it, however and an incentive to invest would certainly help economic activity.
- Boost construction: Introduce incentives for new housebuilding or construction.
- Use billions in pension assets to lend directly to firms or invest in infrastructure with Government underpin: Use the power of pension assets to bypass banks and invest in infrastructure or lend directly to small firms. It is probably necessary to offer a Government or Bank of England underpin for returns in 5-10 years time to mitigate some of the risk.
- Consider ‘helicopter’ tactics: It might well have been more effective if the Bank had sent a “time limited” cheque to all households, rather than letting low interest rates and high inflation continue to squeeze people’s income. This would encourage spending directly!
Conclusion
In light of this evidence, it important that the Bank of England holds back on further gilt-buying. Quantitative Easing (QE) is a policy experiment that may have been worth trying in 2009 to avoid depression but even as the economy was recovering and inflation was above target, the Bank carried on buying more gilts. With inflation pressures rising again, the Bank should more carefully assess the effects of QE before instigating any more measures.


